📊 Distribution Charts – Histogram, Box Plot
Last Updated: 24 Sept 2025
Distribution Charts show how data values are spread or distributed.
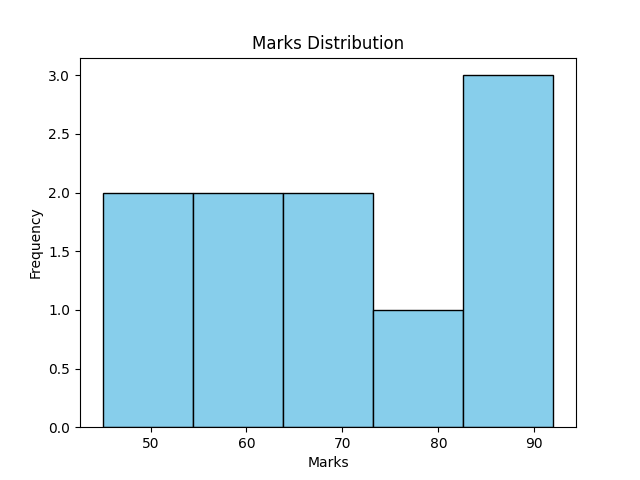
- Histogram → frequency of data ranges
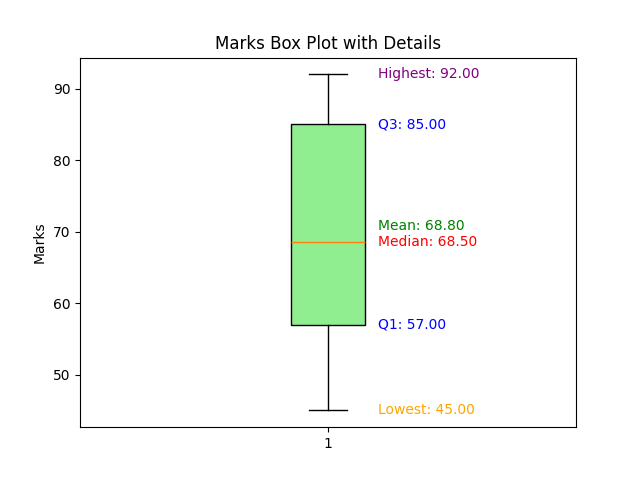
- Box Plot → shows median, quartiles, and outliers
✏ When to Use Distribution Charts?
- To check frequency of values (Histogram).
- To identify median, quartiles, and outliers (Box Plot).
🎨 Color & Style Tips
- Use soft, contrasting colors for readability.
- Highlight outliers with a distinct color.
- Keep axes labeled clearly.
Dos & Don’ts
✅ Do
- Label axes (value and frequency).
- Use grid for easier reading.
- Add title and legend if multiple groups.
❌ Don’t
- Don’t use too many bins in histogram (can mislead).
- Don’t ignore outliers.
- Don’t use fancy 3D effects.
1. Histogram Example
Let us consider the following data:

marks = [45,67,89,56,45,76,88,92,70,60]

You want to create a histogram to show the distribution of student marks.
2. Box Plot Example