📐 Measure of Shape
Last Updated: Jan 2026
Measure of Shape describes the shape of data distribution.
It tells us:
- Data kis taraf jhuk raha hai (skewness)
- Data kitna peaked ya flat hai (kurtosis)
🗣 Hinglish Tip: Shape = data ka overall pattern / curve ka nature
Shape helps to:
- Understand data distribution
- Choose correct statistical methods
- Analyze real-world datasets
Types of Measure of Shape
- Skewness
- Kurtosis
Skewness
Skewness measures the asymmetry of data distribution.
It shows whether data is:
- Symmetric
- Right-skewed
- Left-skewed
Formula Population Skewness
γ₁ = Σ(xᵢ − μ)³ / (N σ³)
Where:
γ₁= population skewnessμ= population meanσ= population standard deviationN= population size
Sample Skewness
g₁ = Σ(xᵢ − x̄)³ / ((n − 1) s³)
🗣 Hinglish Tip: Tail jidhar lambi ho → skewness udhar hoti hai
Types of Skewness
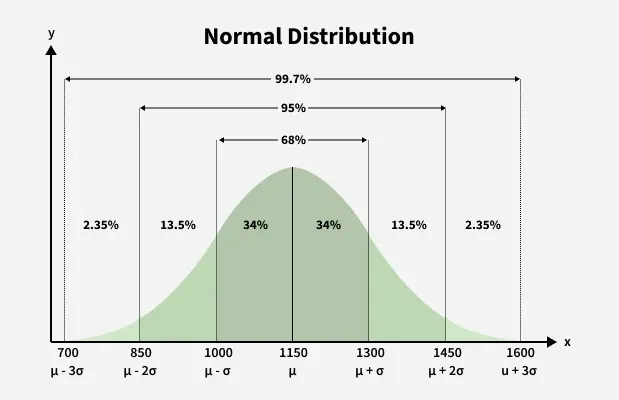
1.Symmetric/Normal Distribution
- Mean = Median = Mode
- Skewness = 0
- Bell shape curve
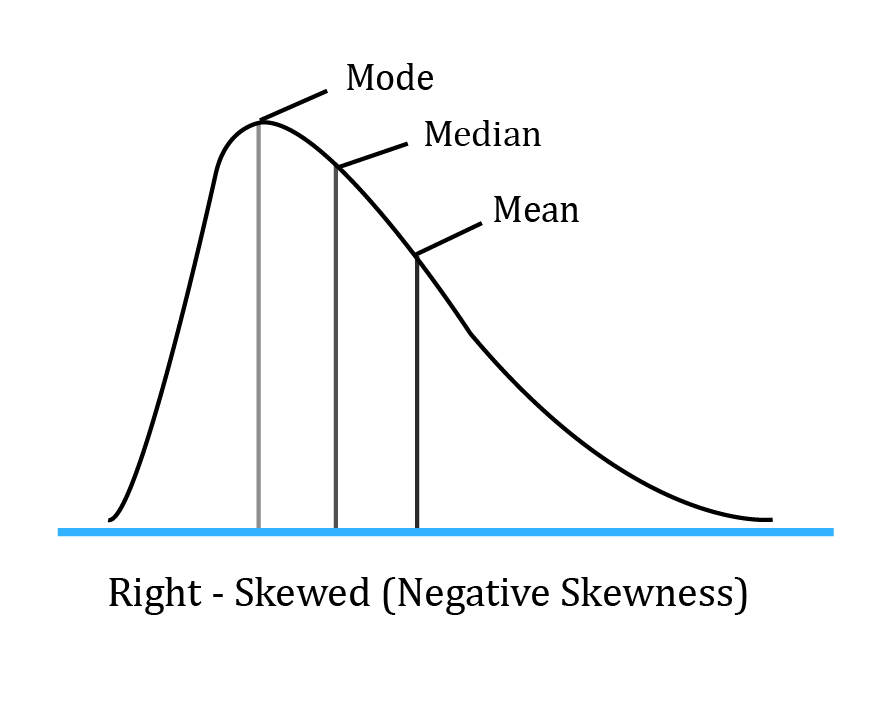
2.Right-skewed/Positive Skewness
- Mean > Median > Mode
- Skewness > 0
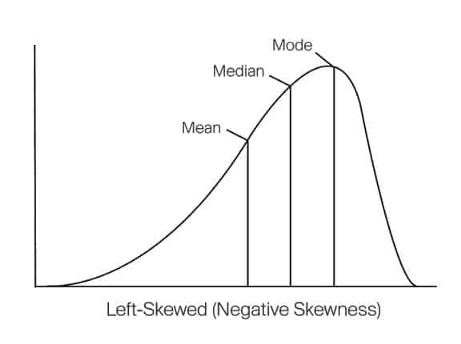
3.Left-skewed/Negative Skewness
- Mean < Median < Mode
- Skewness < 0
Kurtosis
Kurtosis measures the peakedness or flatness of the distribution.
It focuses on:
- Height of the peak
- Weight of the tails
Formula Population Kurtosis
β₂ = Σ(xᵢ − μ)⁴ / (N σ⁴)
Excess Kurtosis
Excess Kurtosis = β₂ − 3
(3 is kurtosis of normal distribution)
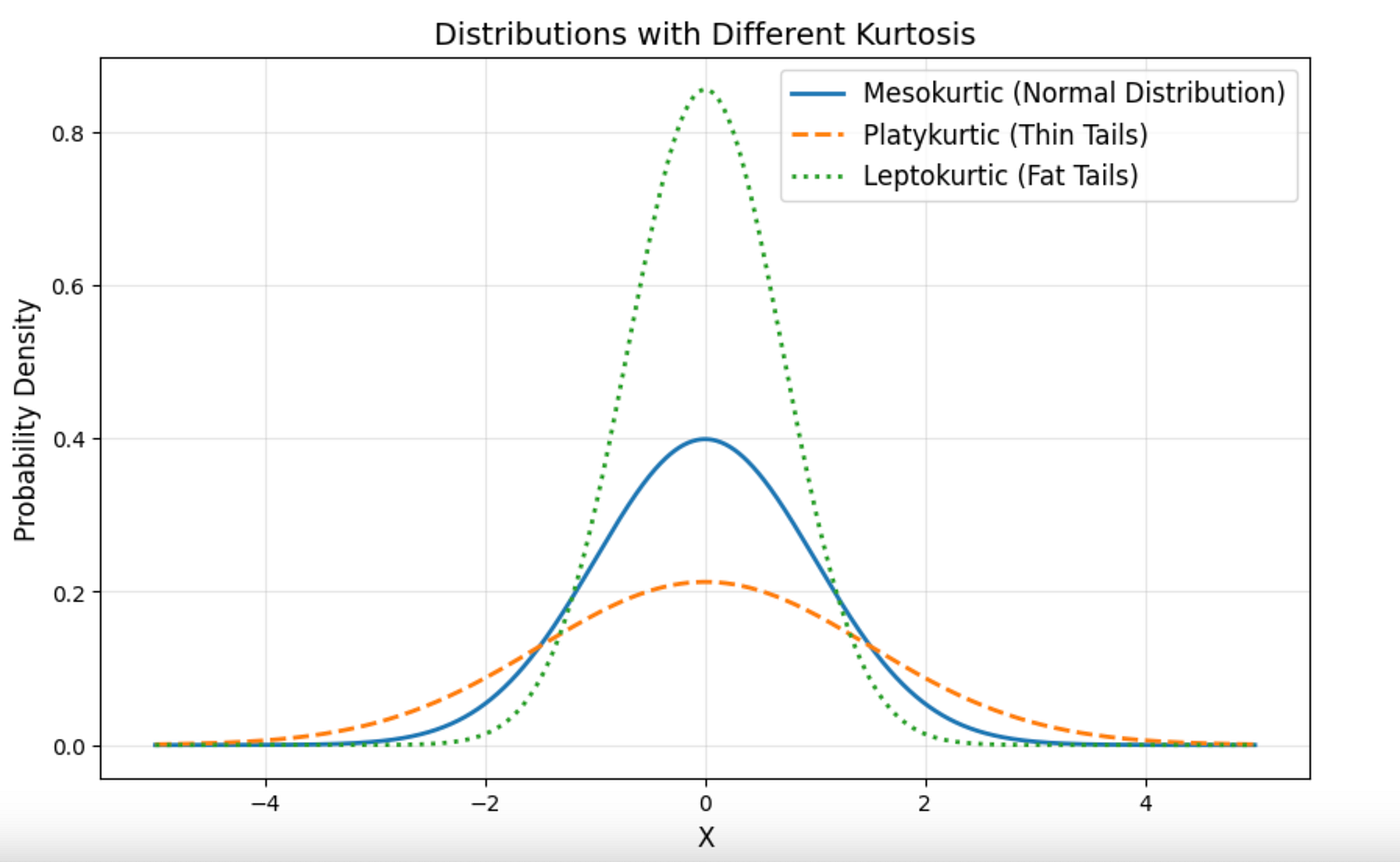
Types of Kurtosis
| Kurtosis Type | Excess Kurtosis | Shape |
|---|---|---|
| Leptokurtic | > 0 | Sharp peak, heavy tails |
| Mesokurtic | = 0 | Normal distribution |
| Platykurtic | < 0 | Flat peak, light tails |
🗣 Hinglish Tip: Kurtosis = curve kitni pointed ya flat hai