📊 Power BI – Overview and Key Concepts
Last Updated : 17th September 2025
Power BI is a Business Intelligence (BI) tool from Microsoft used to convert raw data into interactive dashboards and reports.Help you Analyze and visualize data easily without complex coding.
Key Features of Power BI
- Connect to multiple data sources (Excel, SQL, web, etc.)
- Create interactive dashboards and reports
- Embed data into web applications
- Power BI Desktop, Power BI Service, and Power BI Report Server
- Connect to multiple data sources (Excel, SQL, web, etc.)
- Clean and transform data using Power Query
- Build visuals and charts
- Use DAX formulas for calculations
- Share reports via Power BI Service
Main Components of Power BI
- Power BI Desktop: For building reports
- Power BI Service: For publishing and sharing reports
- Power BI Mobile: View reports on the go
- Power Query: Clean and prepare data
- DAX: Formula language for custom calculations
Power BI File Extensions
- .pbix: Power BI report file extension
- .pbit: Power BI template file extension
- .pbim: Power BI model file extension
- .rdl: Power BI report definition language file extension
Common Visuals in Power BI
- Bar and Column Charts
- Pie and Donut Charts
- Line and Area Charts
- Maps
- Tables, Matrix, Cards, KPIs
Basic Workflow in Power BI
- Get Data ➝ From Excel, CSV, databases, etc.
- Transform Data ➝ Using Power Query Editor
- Build Model ➝ Set relationships between tables
- Create Visuals ➝ Charts, slicers, filters
- Publish & Share ➝ Share via Power BI Service
Power BI Desktop Interface
Here is a screenshot of the Power BI Desktop interface Each Mark number represents a different view which is described below
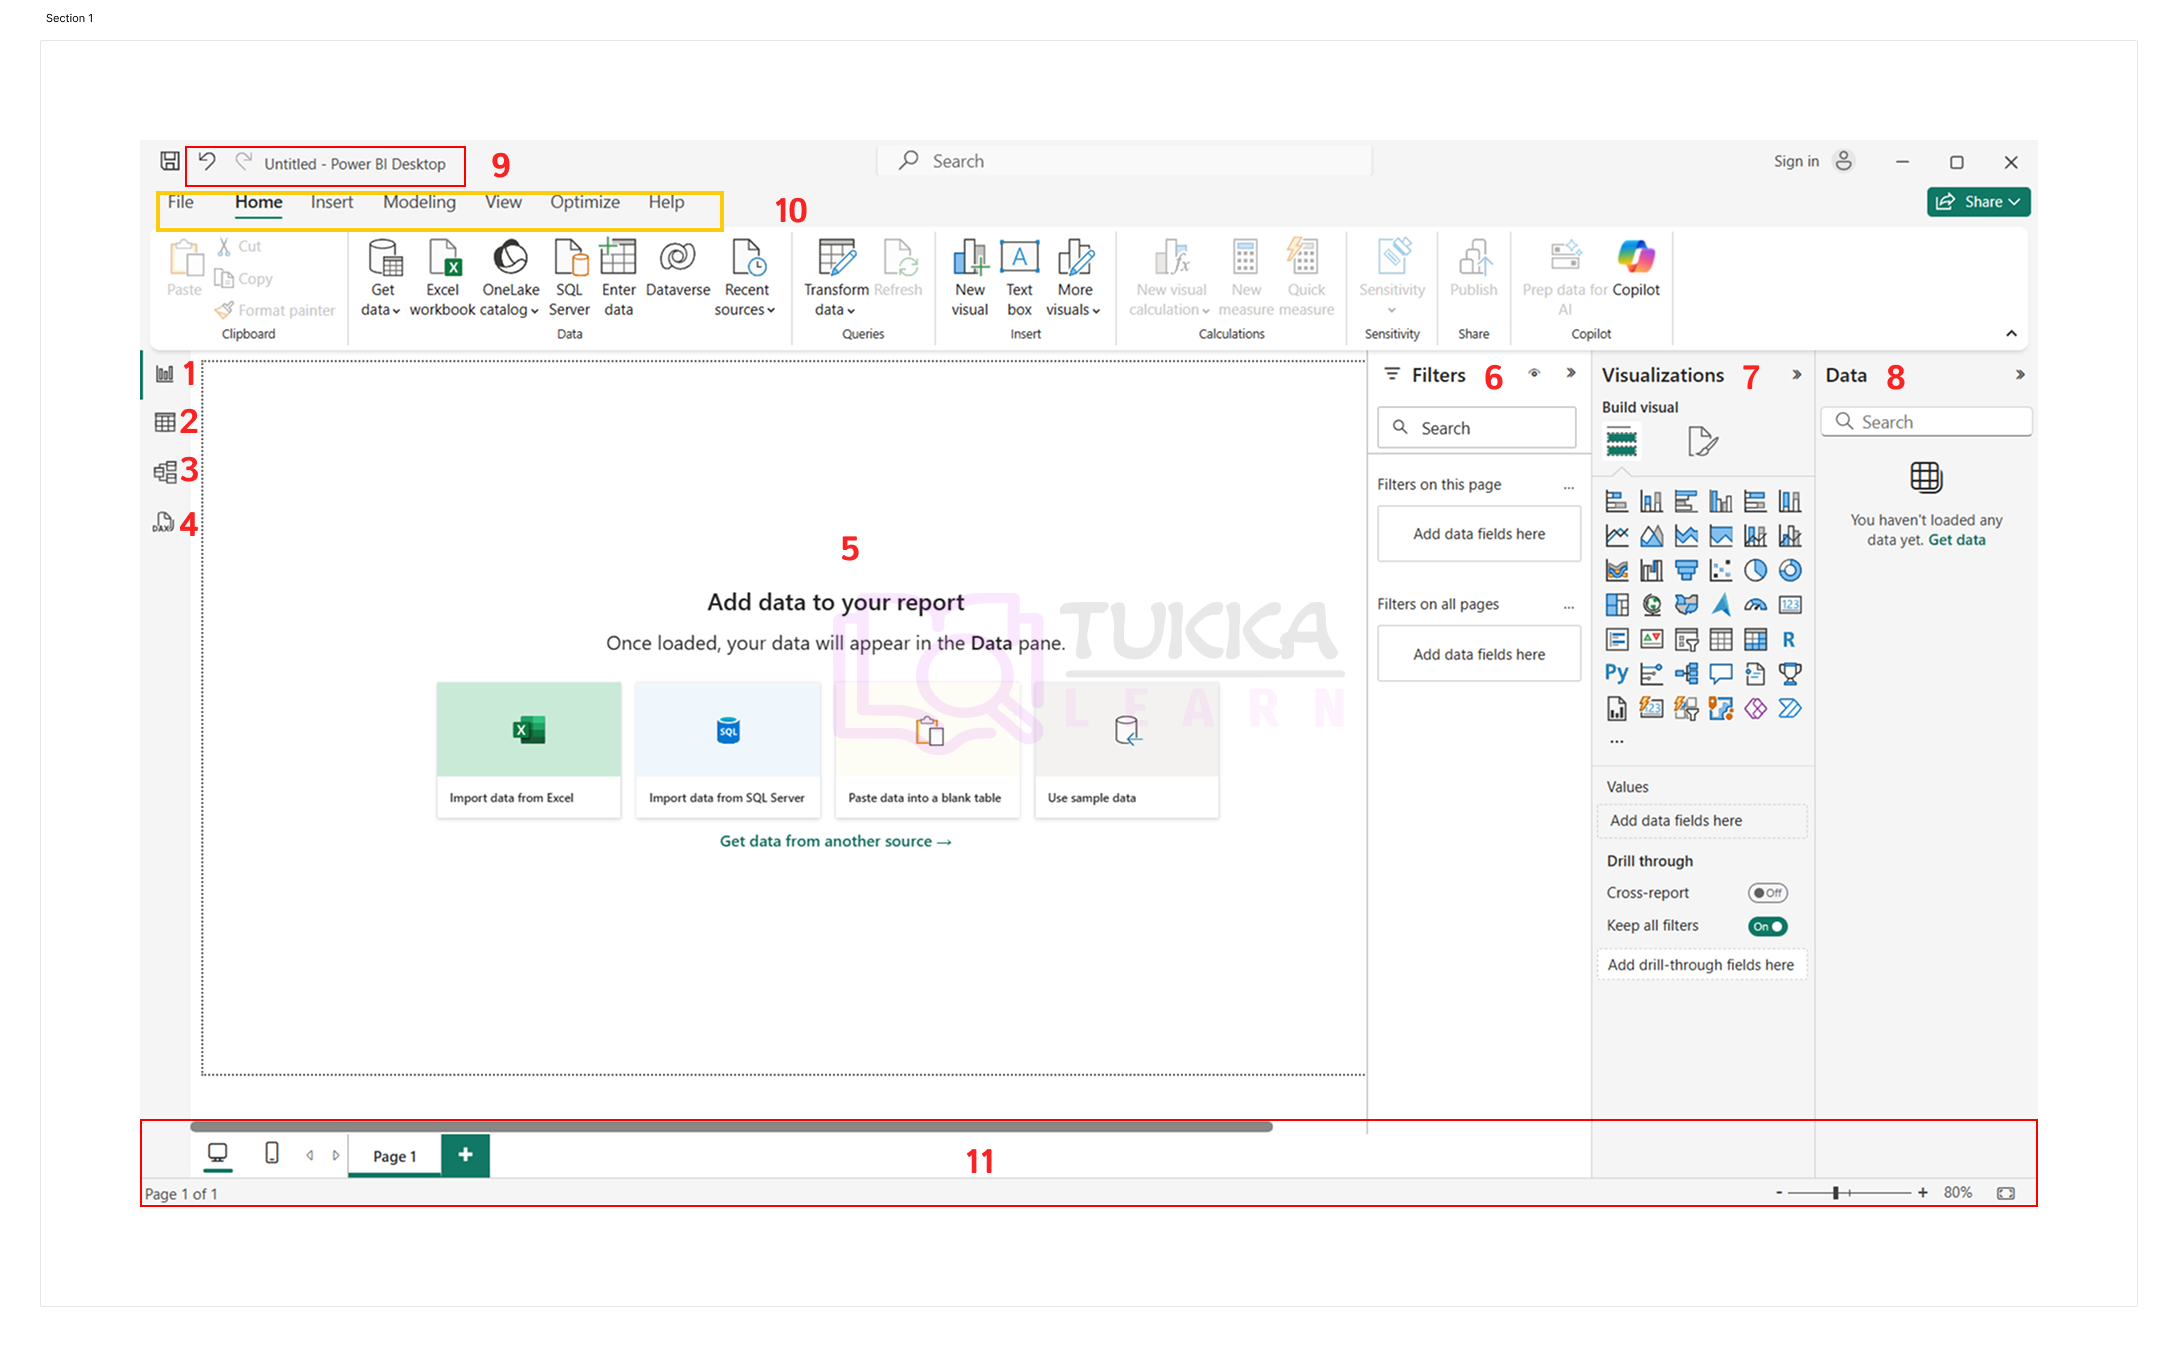
- Report View : Displays the report as you see it in Power BI Desktop.
- Table View : Displays the data as a table.
- Model View : Displays the data model and list of relationships .
- Dax Query View : Displays the DAX query editor.It is use to write DAX queries ,Just like Excel Formulas.
- It is use To view The Report,table ec According To The Selected View.
- Filters : It is use To Filter The Data.
- Visualizations : Use to Create Visuals. Like Charts,Tables etc.
- Data :All Local Data Is Stored Here.
- Title Bar : It Contains The Report Name. Default Report Name Is "untitled"
- Ribbon : It Contains Different Tools. Like File, Insert ,Home, etc.
- Status Bar : It Contains Different Information About The Report. Like Current View, Page Number, Desktop Layout View, Model View, zoom etc